
Sections
Human factors have a significant impact on safety. Understanding the effects of leadership and commitment to safety is essential to developing and maintaining safe working practices.
The United Nations’ International Labor Organization (ILO) estimates that some 2.3 million women and men succumb to work-related accidents or diseases every year, which is the equivalent of over 6,000 deaths per day. Worldwide, around 340 million occupational accidents and 160 million work-related illnesses occur annually (1). The cost of poor safety culture doesn’t just harm a business, its employees, and the environment around it; poor safety culture affects the entire business process and promotes an inability to change.
This article explores why human factors are behind such a high proportion of incidents, what makes a true safety culture, and how the leadership of any company is the differentiating factor in process safety management. It also discusses how committed and effective leadership can drive safety culture excellence so that plants can gain the advantages of greater productivity and profitability by embracing safety as a way of life rather than a purely regulatory requirement.
Background
According to data from the U.S. Bureau of Labor Statistics (BLS), 5,190 fatal work injuries occurred in 2021, up 8.9% from 2020 (Figure 1) (2). This meant that a worker died every 101 minutes from an occupational injury throughout the pandemic, though the overall trend is broadly flat or slowly rising.
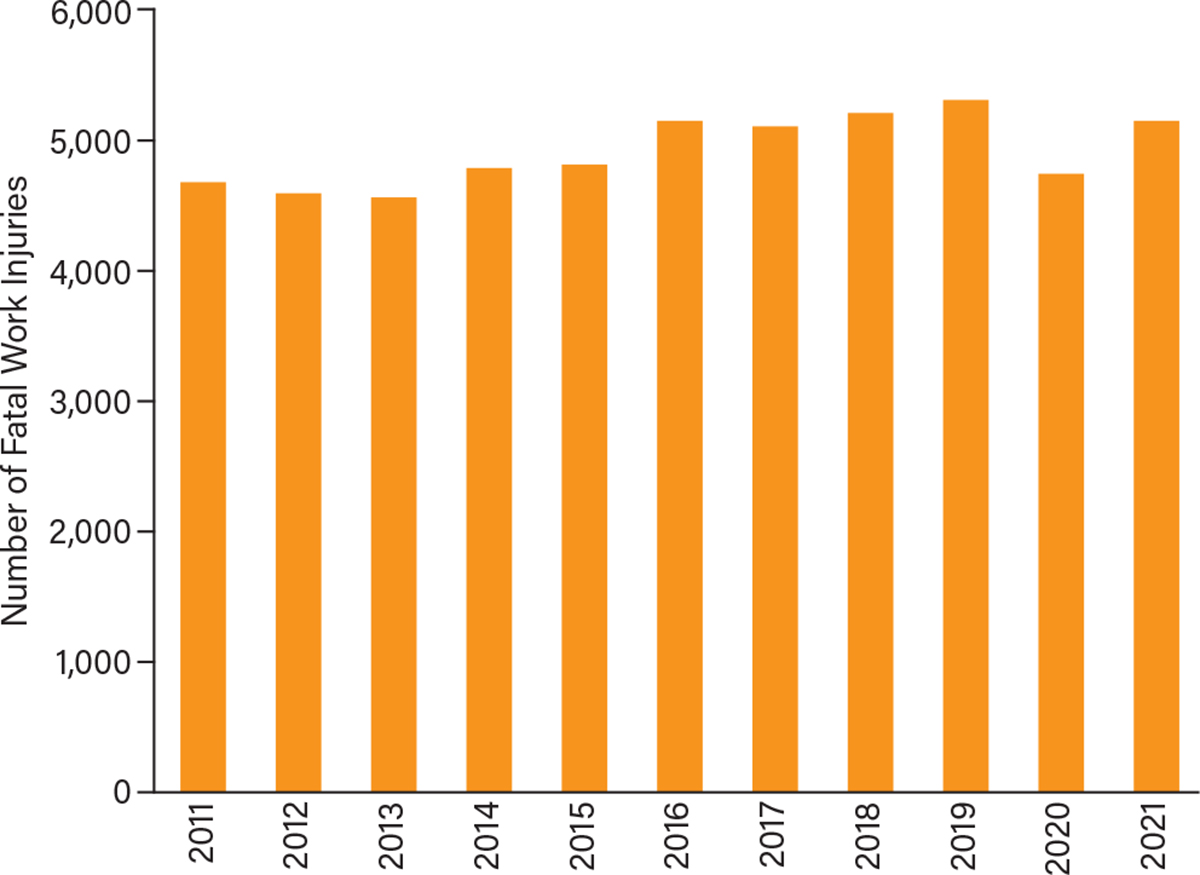
▲Figure 1. The number of fatal work injuries from 2011 to 2021 show a general flat to rising trend throughout the years. Adapted from (2).
When considering non-fatal injuries, the numbers are relatively stable (Figure 2), with 2.7 recordable incidents per 100 workers. Of those incidents, 1.7 of them (or 63%) resulted in days away from work, job restrictions, or transfers.
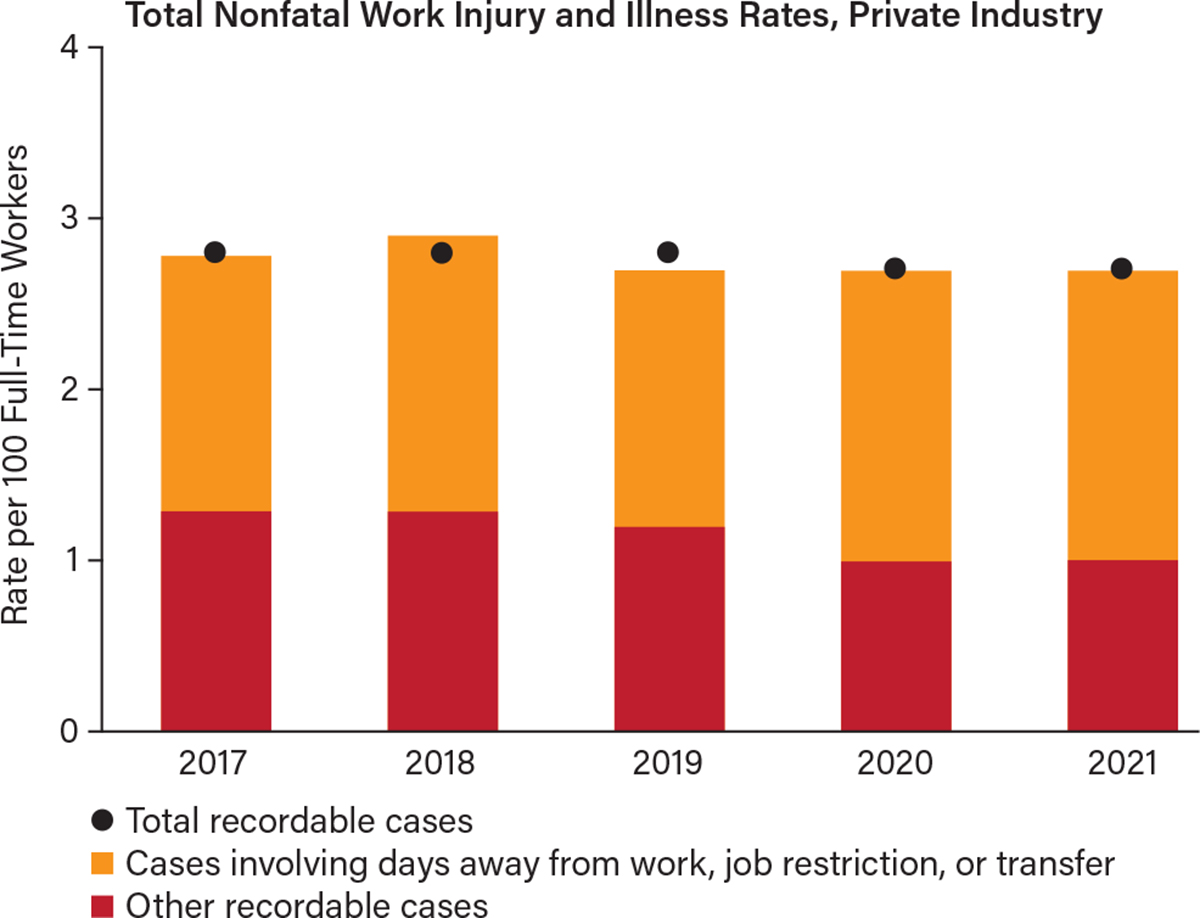
▲Figure 2. For non-fatal injuries, the rates are again relatively stable, with 2.7 recordable incidents per 100 workers, and of those, 1.7 of them (63%) resulted in days away from work, job restrictions, or transfers. Adapted from (2).
Of course, there is good news in this data, too. According to the latest U.S. Occupational Safety and Health Administration (OSHA) data, worker injuries and illnesses are down from 10.9 incidents per 100 people in 1972 to the current rates. The top 10 most frequently cited standards (3) by OSHA in the fiscal year 2021 were:
- fall protection, construction (29 CFR 1926.501)
- respiratory protection, general industry (29 CFR 1910.134)
- ladders, construction (29 CFR 1926.1053)
- hazard communication, general industry (29 CFR 1910.1200)
- scaffolding, construction (29 CFR 1926.451)
- fall protection training, construction (29 CFR 1926.503)
- control of hazardous energy (lockout/tagout), general industry (29 CFR 1910.147)
- eye and face protection, construction (29 CFR 1926.102)
- powered industrial trucks, general industry (29 CFR 1910.178)
- machinery and machine guarding, general industry (29 CFR 1910.212).
These injuries and accidents fall into three main category types and are similar across all countries and industries:
- slips, trips, and falls (including falls from height)
- contact with moving equipment, machinery, or flying or falling objects
- human factors, such as errors and violations.
A common theme is the inability to either identify or communicate hazards and/or to implement the protections necessary to protect workers from forms of energy, power, or motion (lockout/tagout or LOTO).
The overall rates of both fatalities and injuries and illnesses in the workplace may also be underreported. Some undercounts are due to excluded injury types, injuries to self-employed people, and the general design of the survey. Still, this raises a concern that there are disincentives for workers to report injuries due to fear of retaliation, effects on incentive programs, and the like. Also employers may face increased compensation costs and be denied future contracts.
Overall, the estimated cost through fatalities, injuries, and illness is estimated to be between $176 billion and $352 billion per annum in the U.S. alone.
Within this data, there is also concern over the increasing number of repeat violations that result from consistent neglect of worker safety, which has led to the September 2022 update to the Severe Violator Enforcement Program (SVEP) (4). The violations occur across various industries, processes, and risk types and show repeated instances of issues failing to be addressed within those organizations. These repeats are human failures that eventually end up on the leadership’s doorstep.
Human factors have a significant effect on working practices, thus the SVEP aims to prevent repeated failure to comply with process safety management standards.
Leadership drives safety excellence
Control of work (CoW) risks are those associated with work conducted during routine operation of plants and processes, maintenance, turnaround, or construction across all forms of industry. The risks themselves will vary, but at its core, CoW — sometimes known as “permit to work” or the permitting process — consists of three main elements that should always be linked and equally represented to ensure best possible process safety (Figure 3):
- risk assessment: an analysis of the risks associated with the task being carried out, taking into consideration the conditions and the tools being used
- isolation management: the safe isolation of all forms of energy, power, or motion and LOTO processes
- permit to work: the document containing a description of the work and the approvals and associated documents necessary to give final authorization to work.
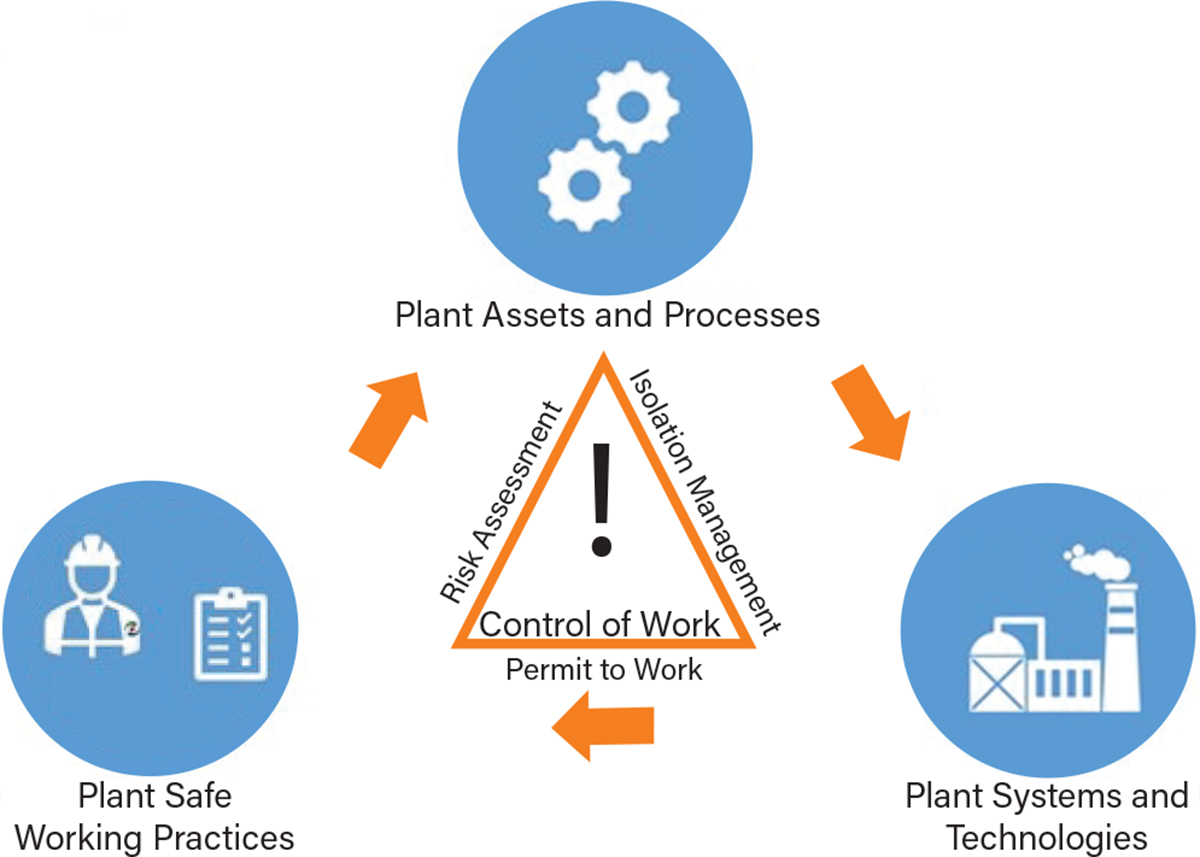
▲Figure 3. In process environments, control of work (CoW) practices consist of three core elements — risk assessment, isolation management, and permit to work.
Safe working practices have differing standards of enforcement around the world. CoW practices may be driven by company, national, or international guidelines, standards, or regulations, such as the UK Health and Safety at Work Act 1974. In addition, companies may also adopt safety management systems such as the International Organization for Standardization (ISO) 45001 or ILO Convention C155. Countries are generally regulated by bodies such as OSHA in the U.S. or the UK or the European Health & Safety Executive (HSE).
Failures to control working practices, particularly those related to health and safety, are behind much of the data in this article. Human factors and leadership within an organization will always be key drivers of both the importance and success of any safe working practices.
Management system improvements (e.g., ISO 45001) and the increasing levels of controls and fines applied by regulatory bodies (e.g., OSHA) are influencing safety, but improvements can be slow to take effect.
An excellent example of simple errors is the Beirut disaster of August 2020, where a large amount of ammonium nitrate was stored incorrectly in port warehouses (Figure 4). Ammonium nitrate is generally used as a fertilizer or industrial explosive. After a period of time, a runaway reaction occurred, ending in a catastrophic explosion that killed 220 people, injured more than 5,000 others, and left an estimated 300,000 people homeless (5).
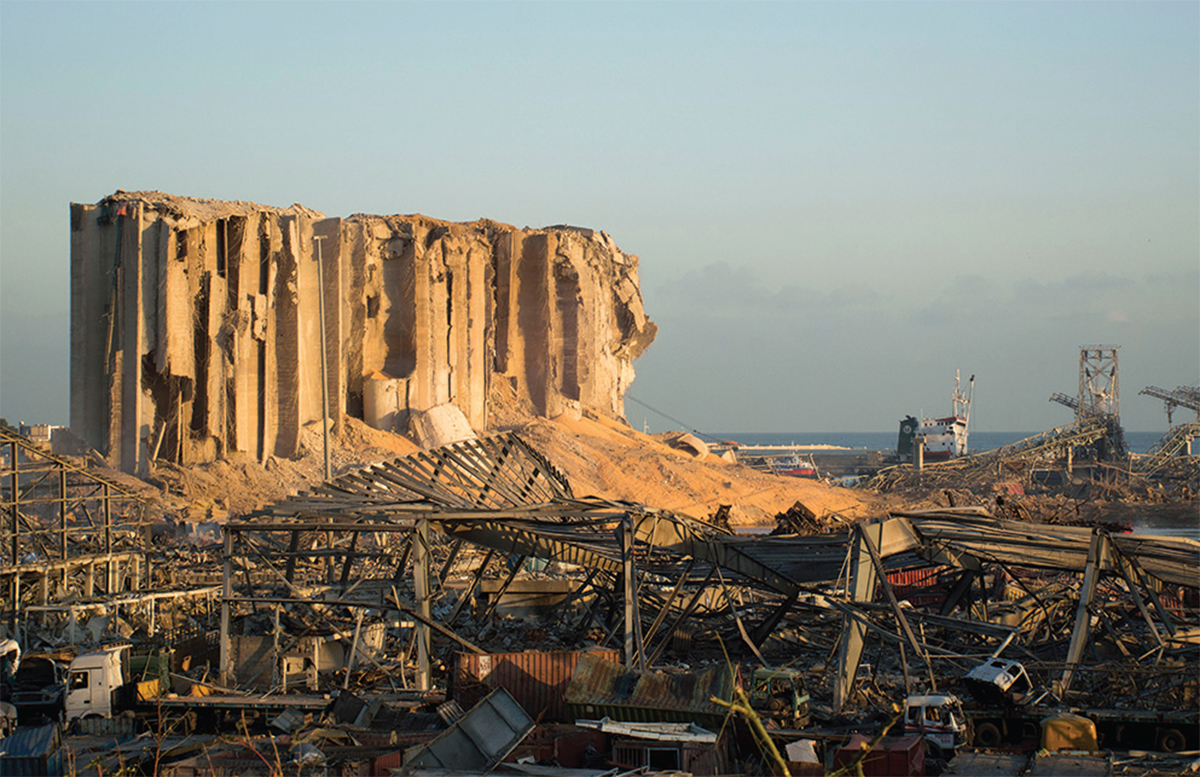
▲Figure 4. The Beirut Port incident that took place August 2020 was the result of the explosion of 2,750 kg of ammonium nitrate.
There are many more examples of process safety issues with ammonium nitrate; it is a known hazardous chemical and has been for the past hundred years at least. Indeed, evidence suggests that several people in authority in Beirut knew there was a risk, as evidenced by a 2021 article by Human Rights Watch (HRW) (6). Hence, the question to ask is why nothing was done.
The root cause of the issue is likely to be a result of various human factors based on lack of knowledge or understanding, forgetting to act, or simply the complexity of navigating bureaucracy. More worrying potential human factors might be those resulting from a willful disregard of the risk or the mistaken belief that it “would not happen this time.”
A crucial point to make is that if such a significant risk cannot be seen and dealt with successfully, then more-minor risks must also be difficult, if not even harder, to manage and mitigate.
Types of leadership and their effects
ISO 45001 is an international standard for occupational health and safety that is applicable to all organizations, no matter their size, industry, or type of business. Section 5.1 on Leadership and Commitment (7) states that those who lead an organization must promote risk-based thinking and emphasize the importance of safety to conform with the operational health and safety (OH&S) requirements, achieve results, and continuously improve. This requires appropriate resources and budget.
To drive safety culture excellence, the leadership of an organization must:
- act as role models and coaches to create a culture of habit
- ensure that safety becomes the key topic of conversation
- implement safe conditions
- support and nurture the tools to enable improvement
- continue to challenge the status quo.
However, different types of leadership will have different effects on the workforce. Figure 5 is a simple image of a building on one side of a busy road, and on the opposite side are the parking areas and facilities for dining and shopping. The example in Figure 5 illustrates the effects of human nature and how leadership can impact it.
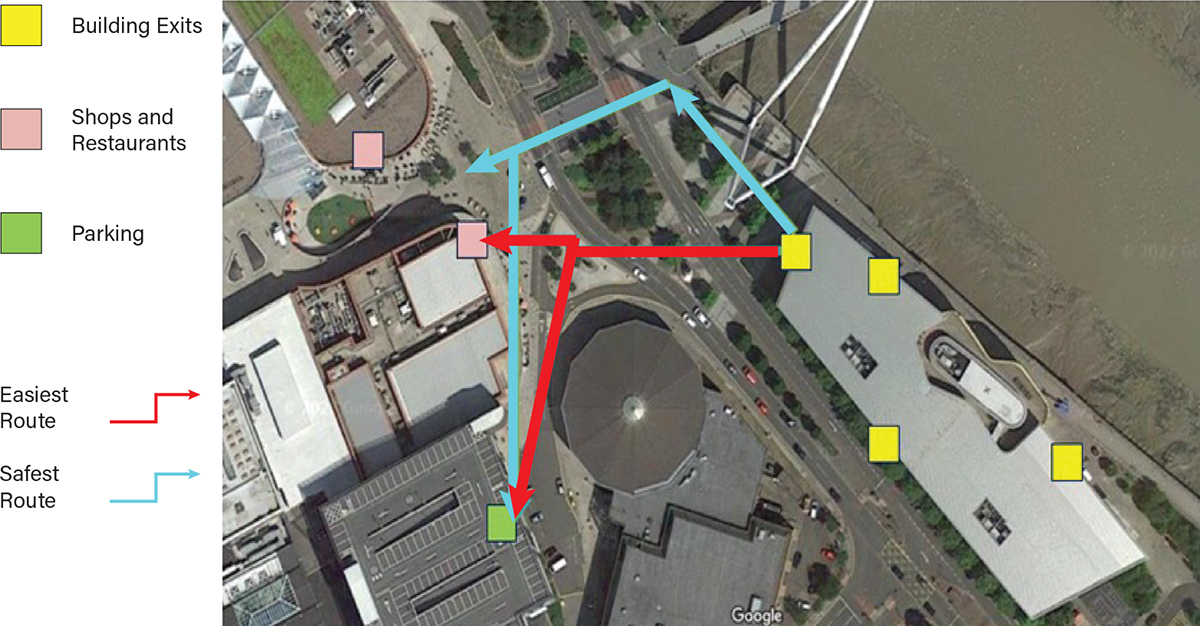
▲Figure 5. The safest emergency evacuation routes may not be the quickest or easiest route. Good leadership is the difference between safe practices and shortcuts.
The route most likely to be taken between two points will almost always be the shortest since it is human nature to take this route if possible (red route). However, the safest route is to walk further and cross safely at the crossing where it is possible to stop the traffic for safe pedestrian passage.
While everyone is responsible for their own safety, the accountability for a safe operation remains with management. Hence, the road example is a good one, and there are several possible solutions. In this case, it is not possible to fully barrier the roadway or the costs may be prohibitive, so it is leadership influence that will be a key driver to effect a change to consistently use the safe blue route as opposed to the more dangerous red route.
Possible leadership options are the following:
- Lead by instruction. This can be as simple as a direct instruction to always cross at the crossing and may include signposts and/or warning signs to direct people to the right place. However, the results of this type of approach tend to last for as long as the workforce believes that the operation’s management is looking.
- Lead by example. Typically, this is the next stage after lead by instruction where the management of the business ‘walks the walk’ and shows that they use the crossing every time. This can be difficult to achieve because everyone has some propensity to fall back into old ways, particularly in this case, if there is no visible traffic. This type of approach, while more proactive than leading by instruction, still falls foul of motivational issues and will only continue if the workforce believes that management continues to care about the issue.
- Lead by coaching. In this case, management builds on both example and instruction. Here, management offers compelling reasons and coaches the workforce on why red route behavior is dangerous, which may include additional training, data on accident rates on the roadway, and the like. This is more effort-intensive for management, but having the reasons why will undoubtedly help embed a blue route culture. However, coaching will not last if the activity isn’t culturally supported.
Ensuring that safety becomes the key topic of conversation
As discussed, the leadership of an organization must promote the importance of safety. The most common methodology used is signage, which may be in the form of physical signs, posters, or other visual items (Figure 6).
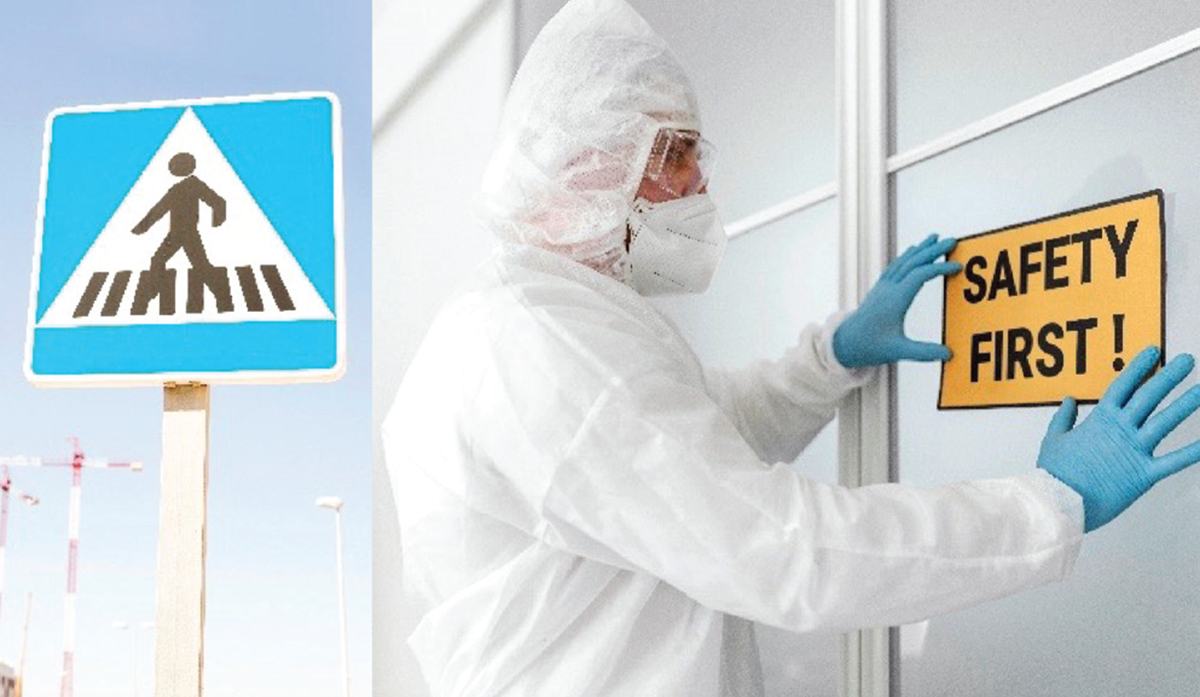
▲Figure 6. Visual signage can be utilized to advise workers of safety precautions.
Signage is important for safety. The first image allows workers to know where they can cross safely. However, the second sign is merely a reminder to say, “Safety First!” Initially, this may have a good reaction, but over time, the sign will likely become wallpaper. Human factors such as familiarity mean that after a period, signs become background and no longer have their initial effect. This is particularly true of signs that convey larger amounts of information, such as infographics.
The risk of relying exclusively on signs and posters is that the initial positive reactions will decline over time as familiarity makes them less noticed. Only by continual promotion of sensible signage can leadership ensure that the messaging is being seen and noticed.
Simple methodologies to achieve this with posters, for example, might be regular changes of background colors on posters, moving posters to different walls, and the like.
It is incumbent on the organization to find ways to make relevant information visible directly at the point where that information is required. Signs are an effective way to do this, with road signs being the most obvious example, such as caution at an approaching junction or bend in the road. Figure 7 shows visual symbols that give an immediate byte of information.
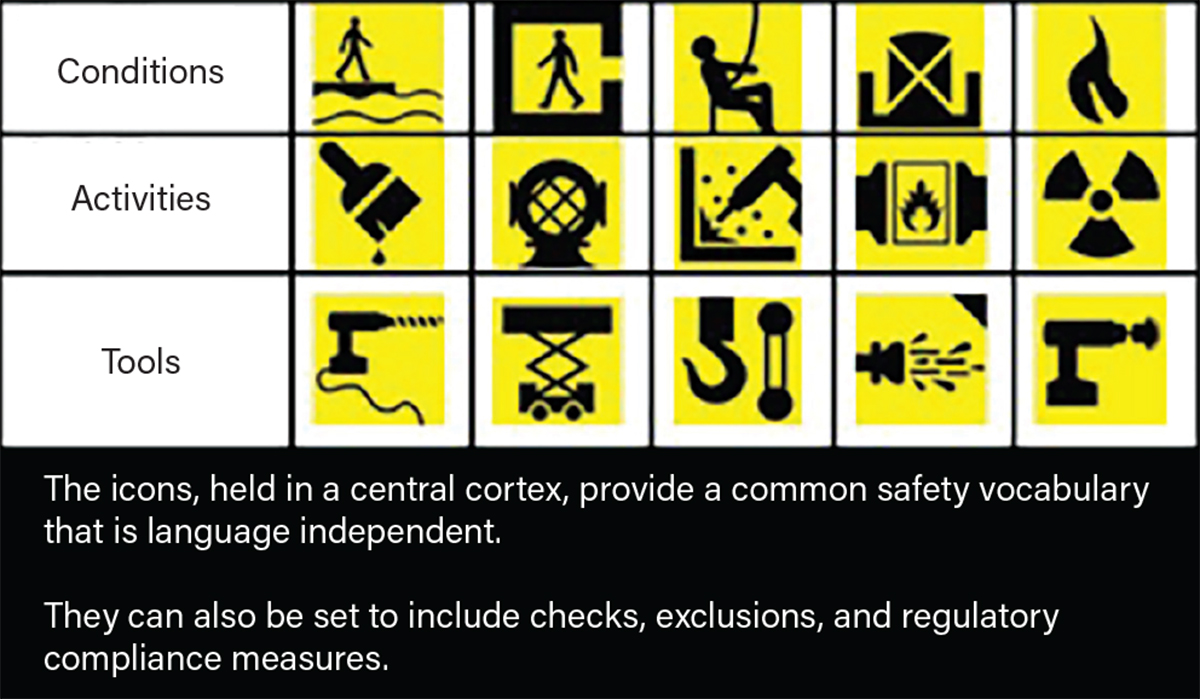
▲Figure 7. Visual symbols, such as these used in Yokogawa’s RAP4 software, help to better communicate safety terms in a language-independent way.
These types of symbols can be used in work process safety systems to better communicate the type of work, the tools being used, and the conditions to the people doing the work. But good safety systems will also allow critical notifications to be placed directly at the point of use where they are needed most, thereby, not only promoting safety but promoting those aspects of it that are critical at that precise moment in time.
Metrics. Another example of attempting to make safety a key topic of conversation is using key performance indicator (KPI) metrics. However, incorrect use of KPIs can encourage the wrong habits, such as in consideration of reporting near misses or hazards spotted. The following data in Figure 8 from Eurostat is an example.
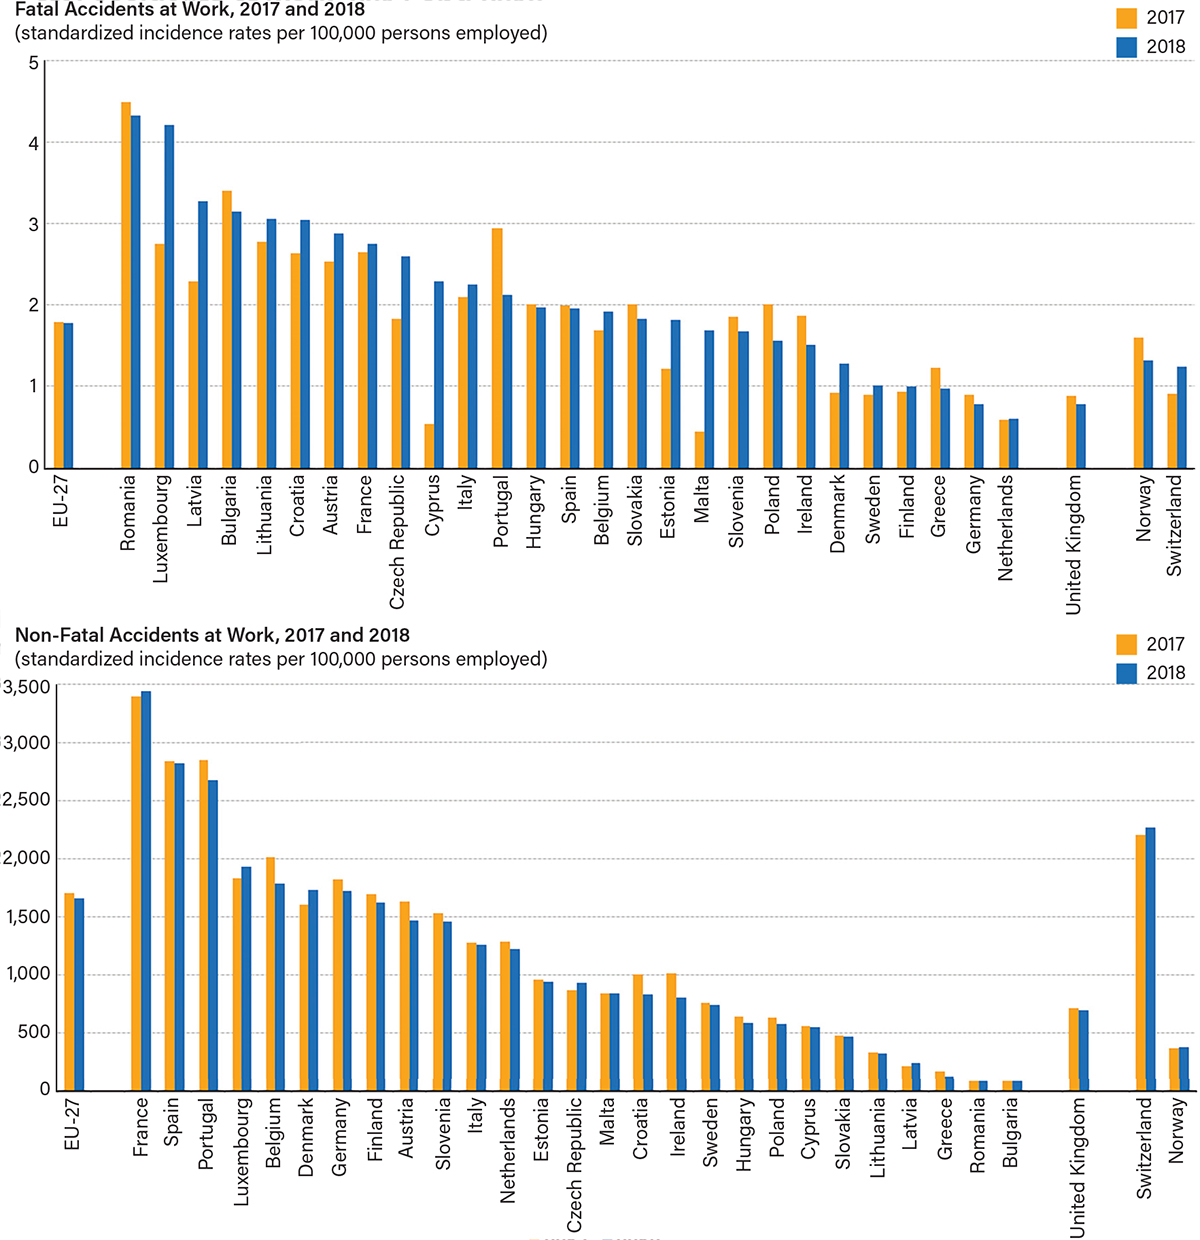
▲Figure 8. Eurostat shows data on fatal and non-fatal work-related incidents in 2017 and 2018. Metrics such as these serve as a good starting point in safety-related discussions. Adapted from (8,9).
In the data, using the UK as an example of generally reliable data, the ratio of fatalities to non-fatal incidents is broadly in the range of 900:1. This number is common across the major European countries. However, for Romania, the ratio is approximately 25:1, due to the extremely low rate of non-fatal incidents. The likely reason for this anomaly is that reporting of non-fatal incidents is either not adequately covered within local reporting requirements or not encouraged, leading to the low number compared to fatalities, which must be recorded by law and are normally accurate.
In either case, reporting of this type of data is a human factor so, in this instance, it would be the responsibility of the leadership of the country to encourage and promote improved reporting rather than accepting data that is clearly questionable. Cultural engagement comes from telling the truth, no matter how bad the starting point is.
In summary, promoting safety requires a considerable amount of time, effort, and resources. Organizations must ensure that messages remain clear and supporting metrics are available for leadership to make good decisions that drive future safety improvement activities.
Implementing safe conditions
Good leadership uses sensible, accurate metrics and endeavors to make activities as visible as possible, with safety improvements driven in line with the general hierarchy of controls (Figure 9).
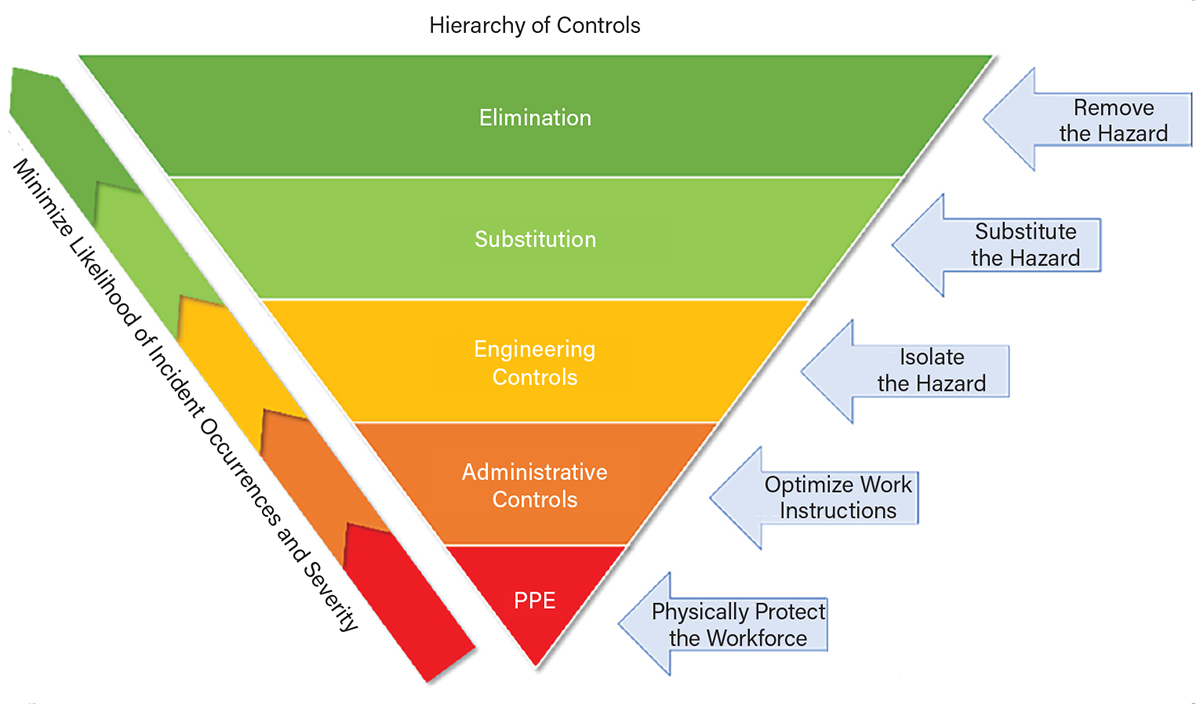
▲Figure 9. Good leadership can be implemented with safety improvements that align with the hierarchy of controls.
Ideally, risks to workers can be eliminated completely or substituted by a safer activity, such as switching from pouring a fine powder to pouring a liquid, but often, a perfect solution is impossible. In such cases, process safety conditions are managed by engineering or administrative controls and by using specific personal protective equipment (PPE) when the risk or likelihood of an instance and/or the severity of an incident is still too high.
The difficulty with controls has often been how to ‘see the forest for the trees.’ Traditional methodologies have focused on amassing information into various work types and then relying on decisions being made based on filling in either paper-based or electronic forms to come to an adequate assessment of the risks involved, and the controls required to be implemented to mitigate them.
As with the Beirut example given previously, we often know there is a risk, but being able to act on it can be difficult.
Figure 10 helps to demonstrate typical examples of mitigating risks. In the left image, two forms of managing confined spaces are shown. The left-hand side of the image shows a traditional form-based methodology that tries to convey every possible type of confined space and makes the user work their way through everything, whether relevant or not.
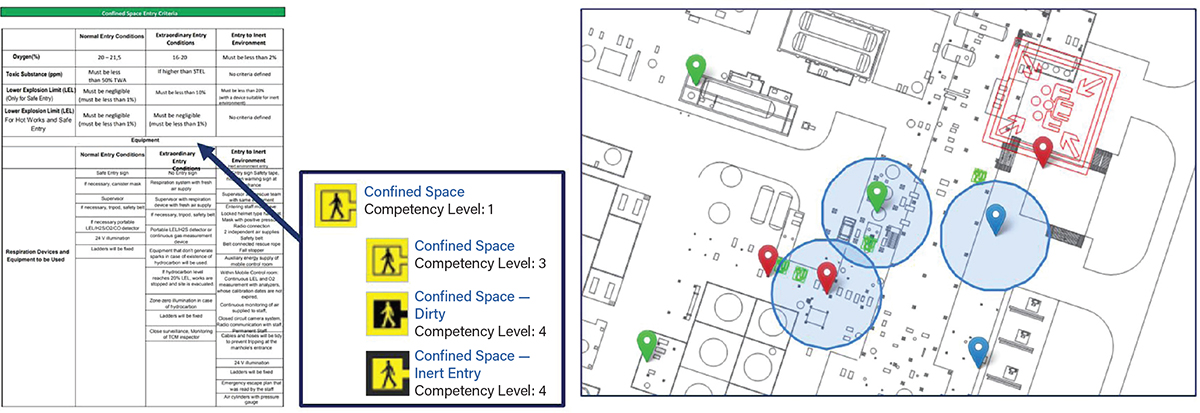
▲Figure 10. There are different ways to view and mitigate risks. The left image shows a traditional paper type methodology for confined space work and how the icons within Yokogawa’s control of work (CoW) software map onto these to make sure that selection is easier for users without losing any robustness. The image on the right shows a simple two-dimensional view showing exclusion zones around certain work types. Where the zones cross or where other pins are inside the exclusion zones, the system will automatically flag the potential presence of simultaneous operations (SIMOPs) that can then be mitigated before any actual work happens as part of daily planning.
This is not only time-consuming but can lead to tick-box blindness. Implementing the conditions for safety should start to drive more intelligent methodologies that allow the same level of rigor but with a specific focus as early as possible.
The right-hand image shows exclusion zones being set around work. This makes it easier and faster to see where there may be conflicts, allowing work teams to more accurately assess and plan work so that there is less risk to the workers, thus ensuring a safety improvement.
These two criteria of breaking down the work more intelligently and making the work itself more visible to everyone can make an enormous difference to safety cultures at sites and have resulted in reductions in excess of 70% on incidents and accidents from using CoW safety systems such as RAP4 from Yokogawa.
Tools to support safe working
Significant safety improvements are possible by using the intelligent methodologies available within today’s safe CoW tools. It is critical that these tools are supported and nurtured across organizations to enable safe, consistent operation for everyone, including third-party sub-contractors and other workers who may not be at the site every day.
Too often, tools are seen as things to implement and forget, to enable an organization to move on to other things, but safety should always be the core foundation of any business, which also falls in line with lean methodologies such as safety, quality, delivery, and cost (SQDC):
- safety: no organization should produce anything without it being via a safe process
- quality: once safety is in place, the focus must be on consistent quality that is acceptable to the customer
- delivery: once safety and quality are in line, on-time delivery should be the focus
- cost: once safety, quality, and delivery are in line with expectations, the focus can shift to cost improvement.
Often, “G” is added as a fifth item for “growth.” When the first four items are in place, true business growth is possible, with increasing profitability, less downtime, and a more engaged workforce who know that their safety is paramount. By this leadership methodology, companies such as Toyota and other lean manufacturing leaders have achieved significant improvements.
The tools used for safe working also enable companies to better manage competence and ensure that the right people are informed, consulted, and involved throughout the process, from initial risk assessment to safe permitting. The tools must be integrated with one another such that there are correct checks and balances within each, as well as an interrelationship between them — from risk assessment to permit creation to isolations, mapping, and then issue.
For example, no permit that requires isolation should be allowed to be issued until the isolation is confirmed in place, and no isolation should be removed until all related work permits have been returned to the safety office. In this way, the tools used to support the work are harmonized to ensure that maximum worker safety is achieved, which also results in increased efficiencies as the tools monitor the work rather than relying on human interventions.
Challenging the status quo
The path to continuous cultural improvement means leaders throughout the organization must be encouraged to challenge existing ways of working to drive toward zero harm. Methods used to challenge the status quo should be constructive in their approach. Some examples of these best practices include:
- ensuring that accountability is built right through the culture
- hosting workshops to engage teams in the processes of safety and build workforce positivity
- ensuring that leadership has a passion and commitment to the momentum gained
- gathering sensible metrics to reinforce compliance and to understand the need for consistency
- making use of workers’ past experiences and knowledge
- allocating adequate resources to ensure that the process works.
The main safety benefit of challenging the status quo is the drive toward the goal of no incidents or accidents, but many other benefits can of course also be derived from the resulting consistency in culture and fundamental way of working that come from the overall effort.
Closing thoughts
The path to continuous safety process improvement is only possible with the active support and encouragement of effective leadership and an emphasis on the human factors that underly current ways of working within an organization. This is only possible if the emphasis is on driving cultural safety improvement instead of short-term KPI goals that may change regularly.
There are many maturity models available for organizations, but in this article, the following is proposed as a practical series of steps to achieve cultural safety improvement:
- Agree to act. The leadership of an organization agrees to act in the best interests of the workforce and the business itself to create an environment where a culture of safety becomes habit.
- Practical measurement. Leaders within the organization agree on a set of realistic, SMART metrics that have evidence-based goals to illuminate the true current state and detail a future state that is achievable as a first-step target. By driving good metrics, the business ensures that safety becomes a key topic of conversation at all levels.
- Visible safety. Leadership must implement the conditions for safety. Activities are conducted in alignment with the hierarchy of controls to drive safety improvement activities, enable safe operations, and make work activities as visible as possible to all. Workers are always responsible for their own safety, but leadership understands that it remains accountable for overall safety.
- Ongoing support. Leadership must consistently support the tools and activities necessary for continuous safety improvement and embed them culturally within the organization so that they become a consistent way of life that is encouraged, not only within the workforce itself but also to visitors to the workplace such as contracted workers. Everyone must understand why safe activities are beneficial and be encouraged to always act safely.
- Continue challenging. As cultural improvement happens, along with the resulting consistency and productivity benefits that normally come with it, leadership must not accept that the journey is ever over from a safety perspective. There must be a continuous drive from leaders within the organization to look for and to implement better ways of working, with safety always being present as a core tenet of any change.
In many ways, this approach resembles a standard plan-do-check-act (PDCA) cycle, where as each cycle is completed, a new cycle begins based on the outcomes of the previous cycle and any new data or changes that have arisen during the process.
Safety is always a journey and one that never ends, but with staunch support from leaders within an organization, allied with human factors — including the will and encouragement to make positive change happen — there is hope for positive and long-lasting cultural safety change.
Literature Cited
- The Economics Daily, “Total of 5,190 Fatal Work Injuries in 2021, Up 8.9 Percent From 2020,” U.S. Bureau of Labor Statistics (Dec. 20, 2022).
- Bureau of Labor Statistics, “Total Nonfatal Work Injury and Illness Rates, Private Industry,” U.S. Bureau of Labor Statistics (Nov. 2023).
- U.S. Occupational Health and Safety Administration, “Commonly Used Statistics,” OSHA, https://www.osha.gov/data/commonstats (accessed Jan. 2023).
- U.S. Occupational Health and Safety Administration, “Severe Violator Enforcement Program,” OSHA, https://www.osha.gov/enforcement/svep (accessed Jan. 2023).
- Guglielmi, G., “Why Beirut’s Ammonium Nitrate Blast Was So Devastating,” Nature, https://www.nature.com/articles/d41586-020-02361-x (Aug. 10, 2020).
- Human Rights Watch, “‘They Killed Us from the Inside’,” HRW, https://www.hrw.org/report/2021/08/03/they-killed-us-inside/investigation-august-4-beirut-blast (accessed Jan. 2023).
- International Organization for Standardization, “Occupational Health and Safety Management Systems,” ISO, ISO 45001:2018 (accessed Jan. 2023).
- Statistics Explained, “Fatal Accidents at Work, 2017 and 2018,” Eurostat, https://ec.europa.eu/eurostat/statistics-explained/index.php?title=File:Fatal_accidents_at_work,_2017_and_2018_(incidence_rates_per_100_000_persons_employed)_AAW2020.png (Nov. 16, 2020).
- Statistics Explained, “Non-fatal Accidents at Work, 2017 and 2018,” Eurostat, https://ec.europa.eu/eurostat/statistics-explained/index.php?title=File:Non-fatal_accidents_at_work,_2017_and_2018_(incidence_rates_per_100_000_persons_employed)_AAW2020.png (Nov. 16, 2020).

Copyright Permissions
Would you like to reuse content from CEP Magazine? It’s easy to request permission to reuse content. Simply click here to connect instantly to licensing services, where you can choose from a list of options regarding how you would like to reuse the desired content and complete the transaction.